Interactive debugging in pwntools
This post is mostly written for myself, since i keep forgetting this kind of commands
The safest workflow
There is a very common trick used to attach gdb to a process controlled by pwntools, and it looks like this:
from pwn import *

local_file = './some_example_elf'
p = process(local_file)

pause()

# ... the rest of your exploit
Pwntools will start the process and print its PID, then it will pause itself.
[+] Starting local process '/challenge/some_example_elf': pid 226
[*] Paused (press any to continue)
This gives you the time to open a new terminal and attach gdb to that PID, with the command
gdb -p <pid>
Then, once gdb started successfully and you optionally set your favourites breakpoints, you can press any key in the python script terminal to resume the process.
This workflow is simple, reliable, and sometimes it’s the only way to use gdb.
Its only drawback is that it’s slow and it requires manual interaction. When you are systematically using gdb in your workflow, for example when you are setting a lot of breakpoints or calling it repeatedly, manual steps could lead to mistakes, or worse, they will be forgotten if you don’t document everything
The elegant workflow
Pwntools makes it very easy to automatically run gdb with the process you are interacting with. The setup is pretty straightforward, this guide covers everything you need to know about it.
The major advantage is that all your workflow will be written as code, including your gdb breakpoints. Paired with git, this makes everything reproducible and easy to maintain
The guide I linked explains all the details, but in a nutshell this is the easiest way to automatically launch gdb with your process:
from pwn import *

local_file = './some_example_elf'
p = gdb.debug(local_file)

# ... the rest of your exploit

p.interactive()
Pwntools will launch gdb in a new terminal window, and you will maintain your ability to interact with the process in the current terminal window
In this snippet p.interactive() serves a double purpose because it prevents the script from quitting.
Without it the python script would immediately reach its end, quitting itself and the
gdb child process it had just launched.
If you don’t need manual interaction with the process you can replace that line with p.wait()
Tmux integration
pwntools automatically detects your terminal type when opening the gdb window. If you are using tmux it will automatically open a new pane in a vertical split. I like to customize the behaviour to open a new panel in a horizontal split
context.terminal = ['tmux', 'splitw', '-h']
interactive python shell
Sometimes i wanto to interact in real time with the process i’m debugging.
For this, there is a better alternative to
p.interactive() that I find useful:
from IPython import embed
from pwn import *

local_file = './some_example_elf'
p = gdb.debug(local_file)

embed()
embed(), just like p.interactive(), serves a double purpose:
it prevents the script from quitting, and at the same time it starts a useful
interactive python shell.
You can use the shell to run python code that interacts with the process, inspecting the results in real time.
The nice part is that all variables or imports you defined in the script will remain available in the interactive shell
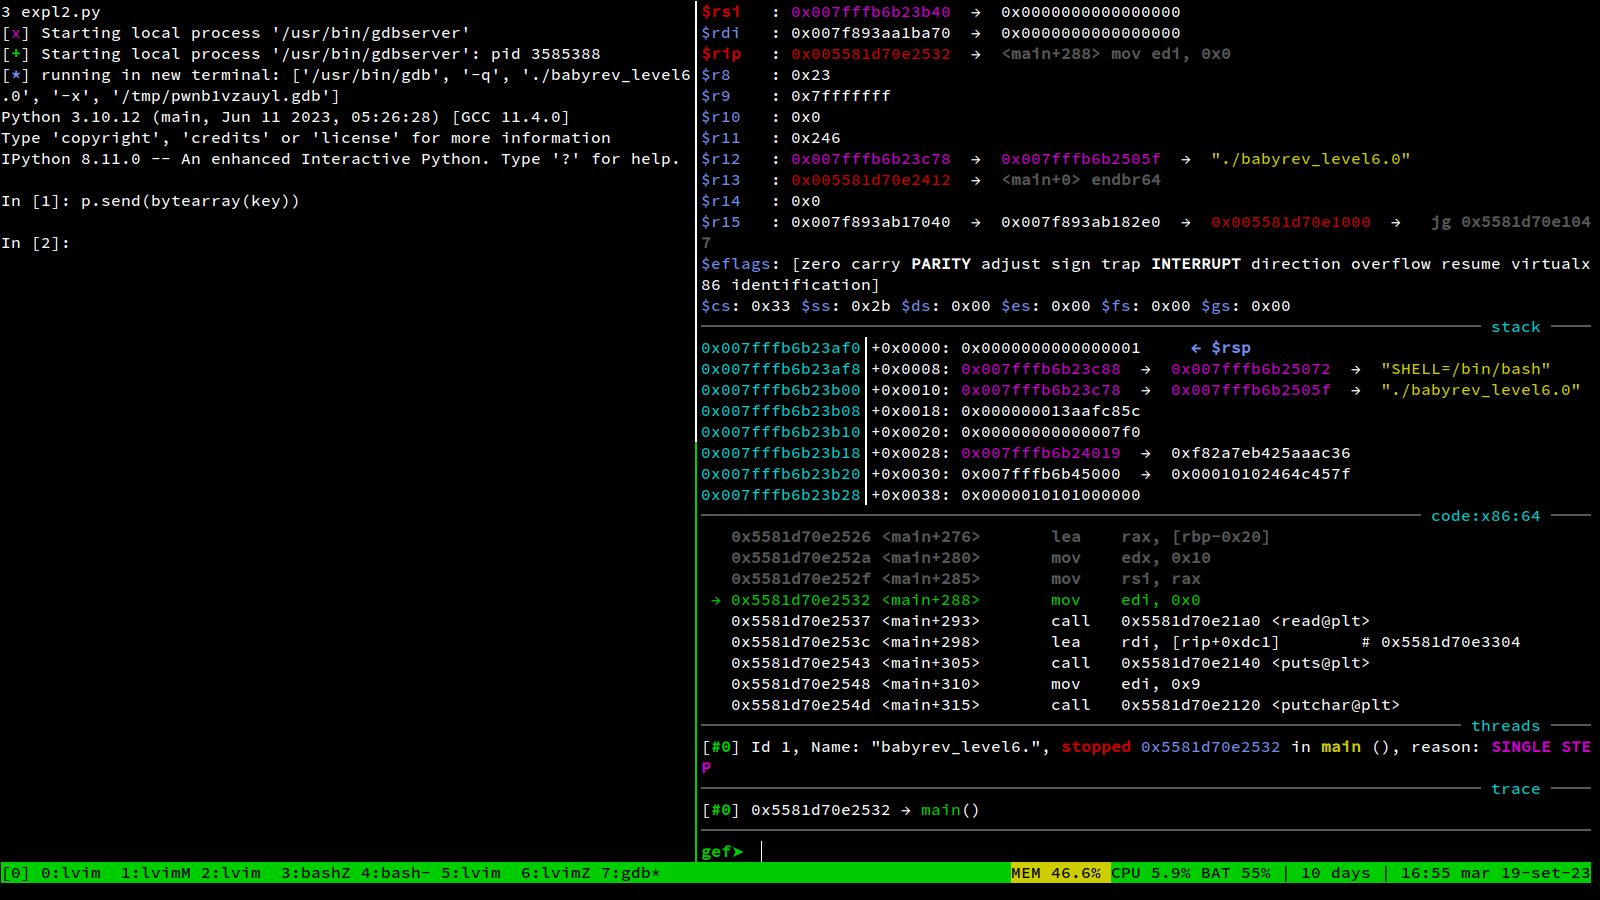
This screenshots shows how it looks like in tmux: In the left pane you can run commands to interact with the process, in the right pane you can use gdb to inspect the results
gdbscript
You can use the gdbscript argument to specify some commands you want to run
every time you launch your process in gdb.
It can be useful to set up some break points for example, but be aware that this requires
some extra steps:
- Disable ASLR, with the argument
asrl=False - Manually find the base address that gdb uses when aslr is disabled.
It usually is
0x00555555554000, you can find it by runningvmmapin gdb. I put this line in my.gdbinit:set $base = 0x00555555554000so every time i need that value I can just use the$basevariable I defined
gdb_script = f"""
break *($base +0x168f)
break *($base +0x18c0)
"""

local_file = './some_example_elf'
p = gdb.debug(local_file, aslr=False, gdbscript=gdb_script)
That’s it
This is nothing new, but so far all these informations were scattered across old exploits, old notes or bookmarked documentation pages, and i really wanted to put them in one place.
This is a template script that includes everything i mentioned above:
from IPython import embed
from pwn import *
context.update(arch='amd64', os='linux')
context.terminal = ['tmux', 'splitw', '-h']

local_file = './some_example_elf'
addr_before_check = "168f"
addr_after_check = "16b7"

gdb_script = f"""
break *($base +0x{addr_before_check})
break *($base +0x{addr_after_check})
"""

p = gdb.debug(local_file, aslr=False, gdbscript=gdb_script)

# here we are sending some bytes to the stdin of the process
some_bytes = b'aaa'
p.sendline(some_bytes)

embed()
#p.interactive()